The Bloomsbury Geographer is proud to publish one of the prize winning capstone assessments, exploring concepts from first year modules.
“Just as all phenomena exist in time and thus have a history, they also exist in space and have a geography”
This statement, used by the US National Research Council (1997: 28), epitomizes the idea that all social and natural phenomena are spatial and cannot be properly understood without a geographical approach. The interpretation of spatiality and its patters, usually referred to as spatial analysis, is one of the fundamental branches of geographical research. Although I was familiar with the concept for many years, before the beginning of my undergraduate studies, I was not aware of its complexity and number of aspects one has to take into consideration to perform an inclusive and appropriate analysis. Firstly, I was unfamiliar with the framework of conceptualising space and how it influences the whole research (What do geographers mean by ‘space’?). Secondly, I was not critical enough towards mapping and did not acknowledge both its negative and positive aspects in regard to spatial analysis (Critical mapping). Lastly, I recognised how both these concepts work in practice on the example of urban geography. I consider the subjects mentioned above to be the ones that broaden my outlook the most and at the same time were the most interesting during my first year of studying geography. In this essay, I will elaborate on these topics and their practical implications.
What do geographers mean by ‘space’?
As Jonathan Raper and David Livingstone (1995: 364) noted, ‘the way that spatio-temporal processes are studied is strongly influenced by the model of space and time that is adopted’. Hence, once reading a geographical paper, it is crucial to critically evaluate the way the author talks about space and assess the limitations of their approach. As space is a complex and multi- dimensional phenomenon, we should discuss how its meaning is/was used in various geographical ‘traditions’.
It is viable to begin with the description of the ‘absolute’ space, an approach which is now rarely adopted; however, in the past, it was implicitly used by both physical and social geographers (Harvey 2008). Space, in this sense, is a ‘fixed entity’ where particular events, objects or living organisms happen to exist (Harvey 2008). Furthermore, it presumes that spaces and places are clearly defined areas with physical borders (both on a national and local scale). The consequence of adopting such a model is the reduction of space into ‘timeless two-dimensional plane’, where spatial changes (e.g. uneven development) are explained by spatial factors only (e.g. regional policies) without assessing the economic and social aspects (Massey 1993; 1999: 262). Such a simplified methodology motivated David Harvey and Doreen Massey to develop the idea of ‘relative’ space.
Adding the social aspect into the understanding of space was a milestone in the geographical study. Firstly, David Harvey (1989) argued that, among various social elements, it is capital (and capitalism) that primarily determine our understating of space. However, it was not until Doreen Massey (1993), that space began to be studied more holistically – acknowledging such matters as gender or ethnicity. She emphasized that every place/space is perceived differently by each person (relative space) – from symbolic meanings to ‘straightforward exclusion by violence’ (Massey 1994: 179). For instance, a place that undergoes gentrification is slowly excluding its former inhabitants due to higher prices and simultaneously changing their perception of the area (exclusion). Massey (1993) moved even further and claimed that space is constructed from relations between people and objects present in it (relational space). The constant movement of different groups of people between spaces leads to contestation and dynamism of relationships; therefore, spaces in this sense are continually modifying (‘places are processes’). It can be illustrated by the power-geometry of time-space compression.
Time-space compression, an idea that technological innovations and globalisation (e.g. phone or plane) metaphorically condense spatial and temporal distances, affects people differently – often in a negative way (Harvey 1989; Massey 1999). That is why we should critically assess this process and be able to take responsibility for issues that occur in other (sometimes very distant) areas. For example, through our consumption patterns, we may affect the viability of Asian sweatshops that exploit the poor and violate basic human rights. People who do not think about power relations in connection to spatiality embodies the assumption that considers ‘local place as the seat of genuine meaning and global space as the abstract outside’ (Massey 2004: 7). It is our duty, as geographers, to change the way we think about space and demonstrate that distance does not free us from taking the responsibility for certain issues. The things that might help us achieve that are maps as well as data visualisations.
Critical mapping
Before illustrating the positive aspects of mapping in understanding space and spatial analysis; however, it is essential to critically discuss how cartography developed from an exclusive western tool to become beneficial across miscellaneous disciplines.
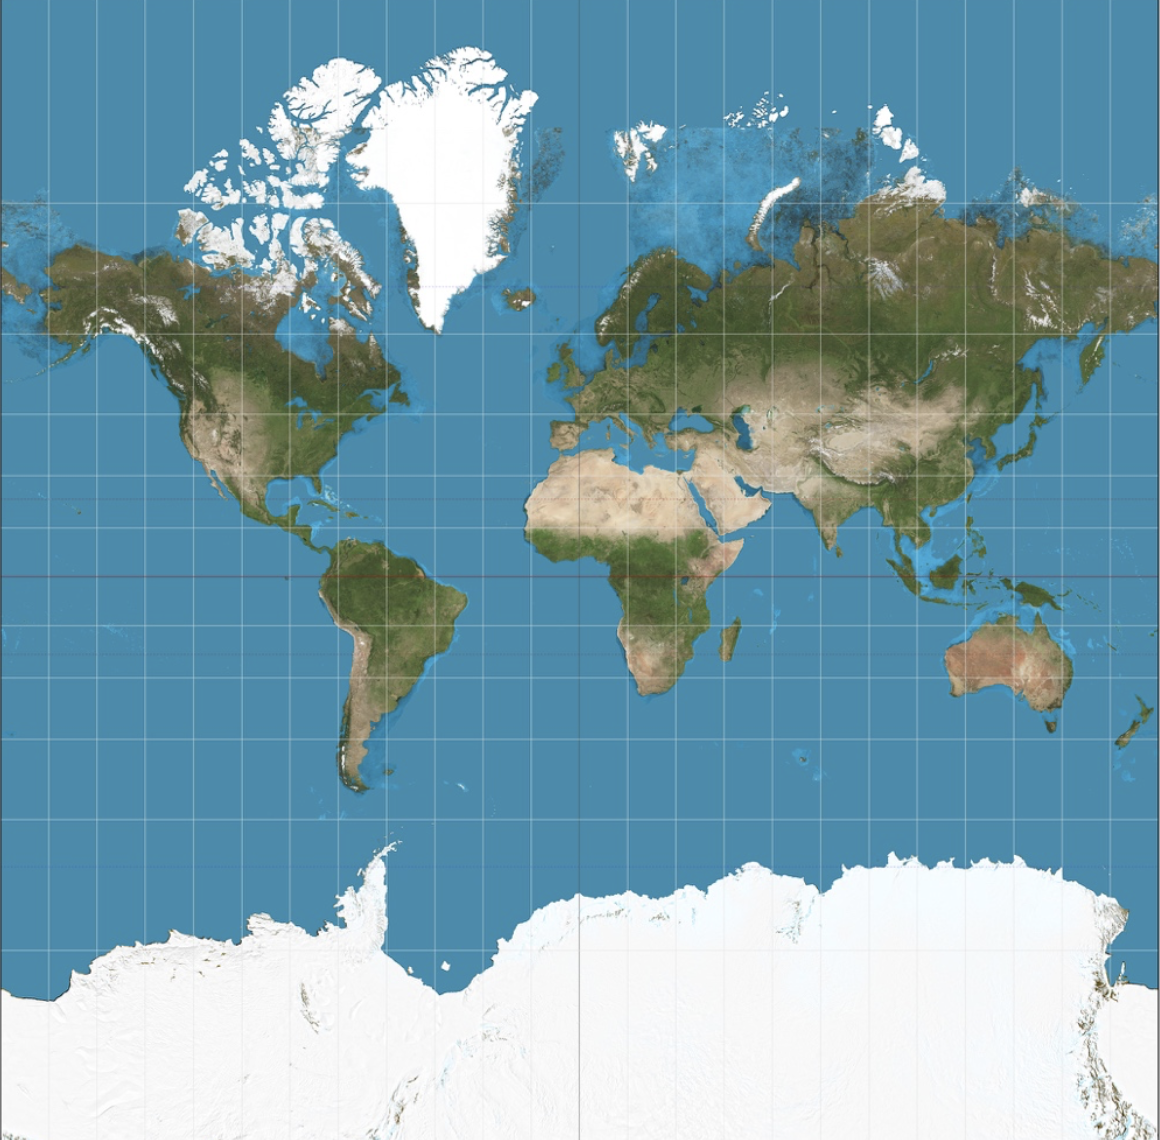
Maps are pivotal in shaping the way people perceive and locate themselves in our world (Bier 2017). It was specifically relevant during the 16th and 17th centuries when European cartographers were completing ‘blank spaces’ of the globe and at the same time structuring people’s ‘planetary consciousness’ (Pratt 2007). The maps created back then – most notably Mercator projection (1569) – were used for both representation of our planet and ship navigation. As Mercator Projection (see Fig. 1) is a conformal map, presenting any segment of constant bearing as a straight line, it is uniquely suited for marine navigation. Nonetheless, apart from its positive aspects, it was also used for Imperial narration of European superiority (e.g. through size distortion which makes Europe seem relatively bigger) that shaped the power- relation between Europe and the rest of the world (Peters 1983). It is epitomized by the statement of Brian Harley (1988: 282), ‘as much as guns and warships, maps have been the weapons of imperialism’.
It took more than three centuries for cartographers and geographers to openly address the political implications of mapmaking (Wolter 1975). In the aftermath of the two World Wars, in which maps were used as propaganda tools, there was a visible shift towards ‘neutral’ mapping (Pickles 2004; Crampton 2010). An informal leader of this shift was Arthur Robinson (1952), who argued for a systematisation of mapmaking. In his view, there were two ways to distinguish scientific and non-scientific maps: formal standardisation (in his view – irrational) or examination how maps are used and perceived in practice (Robinson 1952: 19). The examination would be based on studies of cognition; for instance, psychological effects of colour. Such an approach, in Robinson’s opinion, would result in both neutral and practical designs.
Simultaneously, there was a movement claiming that maps are always biased and cannot be unpolitical (Peters 1983). Although it divided practitioners of cartography (maps are neutral) and other geographers (maps are political), the study of cartography transformed critique into a positive thing and become more inclusive than ever (Crampton 2010; Wood 1992). In the spirit of postmodernism, the critique should be defined as a grasp of one’s assumptions and familiar notions, not as an adverse issue (Foucault 1983). Thus, once geographers accept the fact that projections are inevitably political, they can critically address their work and make maps address a good cause. For example, participatory GIS was essential in improving spatial planning for conservation projects in Bangladesh (Fig. 2) (IUCN 2011). In this instance, GIS eased the human-elephant conflicts and supported indigenous communities; showing that, when managed properly, maps are very valuable.


Lastly, since John Snow’s inquiry into the London cholera outbreak of 1854 (Fig. 3) cartographers have been making more and more maps which illustrate the spatial spread of various social elements. An excellent example is a cartogram, map that is distorted to convey the information about some thematic variable. In such form, maps are no longer merely area descriptors (‘absolute space’) but become more complex and include interesting social aspects (fusion of data visualization and maps). As in the case of ‘space’, the addition of social components makes maps more inclusive and results in holistic analysis. Furthermore, they can help to understand the power-relations between countries and encourage to think about space in the context of responsibility. For instance, cartograms of the proportion of the total CO2 emissions in 2015 (Fig. 4) and proportion of all droughts between 2000 and 2017 (Fig. 5) may visualise us that although developed countries are the largest climate change contributors, developing countries are the ones disproportionally affected by it (Anguelovski & Roberts 2011). I do realise that the issue of droughts is much more complex and cannot be explained solely by CO2 emissions and two cartograms; however, I want to emphasize that maps and data visualisations are powerful tools that can increase the public’s awareness about the uneven standards of our society. Moreover, cartography is also beneficial on a smaller scale, as we will see on the example of urban spatial analysis.


Urban spatial analysis – inequality within cities
The sections about the conceptualisation of space and the evolution of mapping portray the development of two important components of geography. In both cases, the addition of social element into the discussion dramatically changed the narration about spatiality, especially in regard to inequality and power relations.
The inequality issue that disturbs me the most is the uneven development in cities. What conceptualisation of space gives us, in this case, is the comprehension that spatial inequality goes much deeper than the availability of jobs (Massey 1994). As mentioned before, the same spaces may be viewed differently by various social groups. It is the most apparent on the example of the distinction between private and public, and specifically an attempt to restrict women to domestic spheres. Such separation of workplace and home constricts women to become ‘economically active’; thus, exemplifying that spatial control often results in social control (Massey 1994). Without using terms such as ‘relative’ or ‘relational’ space, we would not be able to address inequality within cities as we do now.
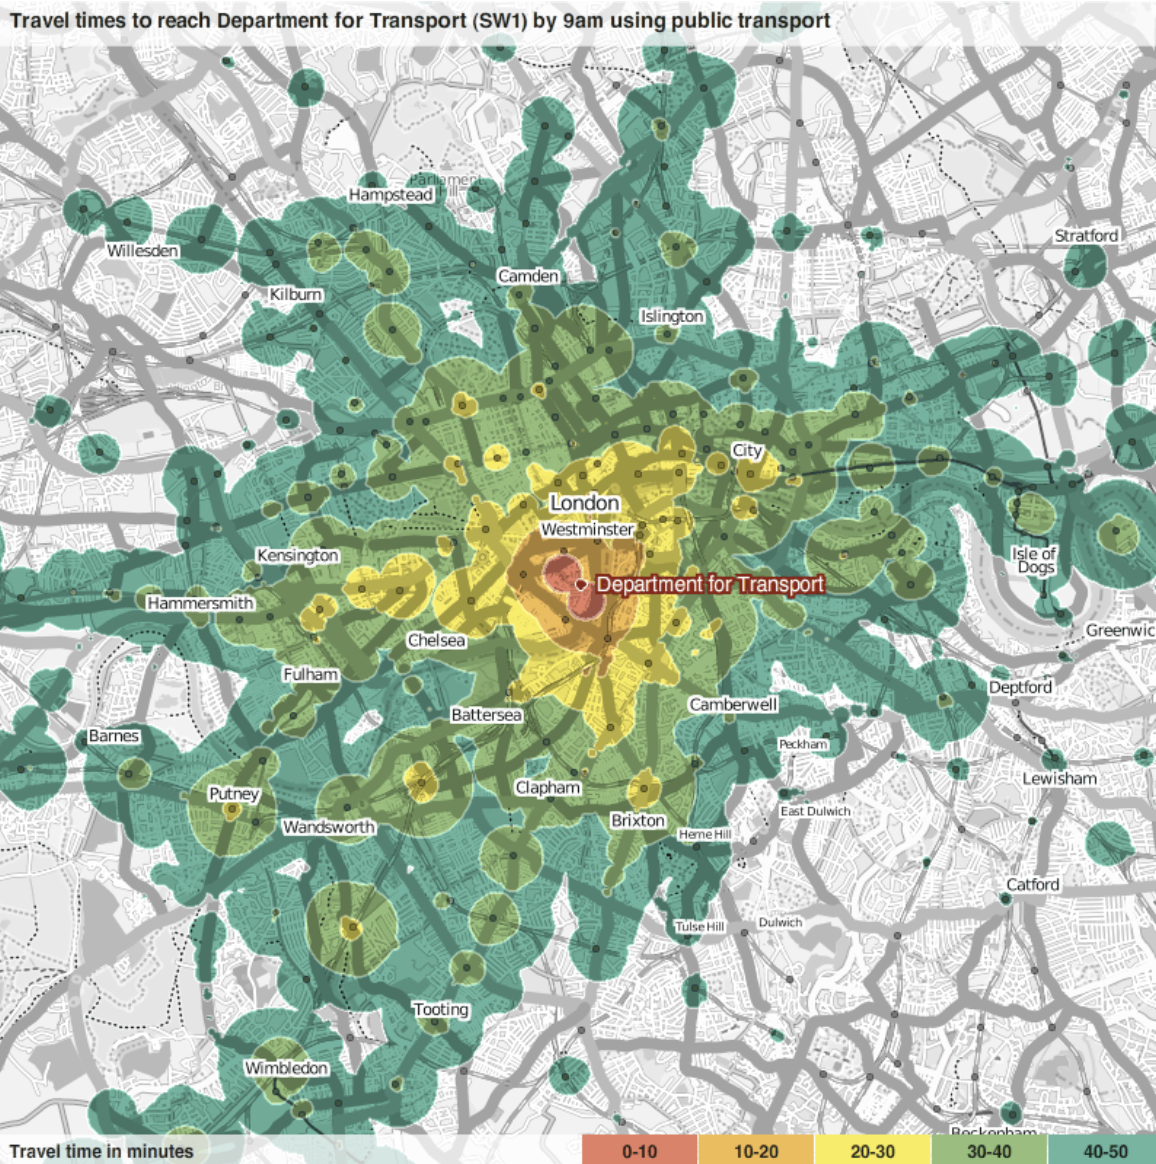
Maps play a great role in portraying inequality in urban areas as well. They can, for example, help us understand why London is considered to be the ‘poverty capital’ of England and one of the most unequal cities in the world (Dorling 2014: 83). From miscellaneous maps that may help us, we will look at the time-travel map (Fig. 6). Although it is not the most evident choice, it portrays the relativity of space in the context of mobility. It clearly shows that transportation lines play a huge role in the accessibility of a certain area. People living relatively close to the city centre, for instance in Camden, still might travel there longer than the ones living in Wimbledon. Poor communication is equal to exclusion from economic activity in certain instances; therefore, it is crucial to address (im)mobility and stop the growth of the inequality gap (Massey 1993). As already emphasized before, visualisations ought to lead the change in the narration about urban issues and advocate for the victims of inequality.
Conclusion
Although conceptualisation of space, mapping and urban geography are just a few topics I studied during my first year at the university, they are the ones that changed my outlook the most. I was able to look at urban geography, the subject which personally interests me the most, from a totally different perspective. The concepts of relative space and critical mapping showed me that proper research is very complex and requires us to see through various limitations. The way we study spatiality developed greatly since John Snow’s times; yet, it needs to evolve further and become even more inclusive. As portrayed beforehand maps, if managed properly, may help us to set a proper narrative about the distribution of both natural and social phenomena, including the inequality. Nonetheless not every spatial phenomenon can be visualised and described using maps – that is why we need the conceptualisation of space. It is essential that conceptualisation and visualisation of space complement each other and together be a foundation of spatial analysis.
Bibliography
Anguelovski, I. and D. Roberts (2011) ‘Spatial justice and climate change: multiscale impacts and local development in Durban, South Africa’ in J. Carmin and J. Agyeman (eds) Environmental Inequalities Beyond Borders: Local Perspectives on Global Injustice, Cambridge: MIT Press, 19-44.
Bier, J. (2017) Mapping Israel, Mapping Palestine: How Occupied Landscapes Shape Scientific Knowledge, London: MIT Press.
Crampton, J. W. (2010) Mapping: a critical introduction to cartography and GIS, West Sussex: Wiley- Blackwell.
Department for Transport (2007) ‘Map showing travel times to reach Department for Transport (SW1) by 9 am using public transport’ (WWW), London: Department for Transport (https://www.mysociety.org/2007/03/05/more-travel-time-maps-and-their-uses/; 25 June 2020).
Dorling, D. (2014) Inequality and the 1%, London: Verso Books.
Foucault, M. (1983) ‘The subject and power’ in H. L. Dreyfus and P. Rabinow (eds) Michel Foucault:
Beyond Structuralism and Hermeneutics, Chicago: University of Chicago Press, 208–226.
Harley, J. B. (1988) ‘Maps, knowledge, and power’ in D. Cosgrove and S. Daniels (eds) The Iconography of Landscape: Essays on the Symbolic Representation, Design and Use of Past Environments, Cambridge: Cambridge University Press, 277-312.
Harvey, D. (1989) The Condition of Postmodernity, Oxford: Basil Blackwell.
Harvey, D. (2008) ‘Space as keyword’ in N. Castree, D. Gregory (eds) David Harvey: A Critical
Reader, Oxford: Blackwell, 70-93.
IUCN (2011) ‘Conserving nature and wildlife through participatory GIS’ (WWW), Gland: IUCN (https://www.iucn.org/content/conserving-nature-and-wildlife-through-participatory-gis; 26 June 2020).
Massey, D. (1993) ‘Power-geometry and a progressive sense of space’ in J. Bird, B. Curtis, T. Putnam and L. Tickner (eds) Mapping the Futures: Local cultures, Global change, London: Routledge, 60-70.
Massey, D. (1994) Space, place and gender, Minneapolis: University of Minnesota Press.
Massey, D. (1999) ‘Space-Time, ‘Science’ and the Relationship between Physical Geography and
Human Geography’ Transactions of the Institute of British Geographers, 24, 3, 261-276. Massey, D. (2004) ‘Geographies of responsibility’ Geografiska Annaler: Series B, Human Geography,
86, 5-18.
Peters, A. (1983) The New Cartography, New York: Friendship Press.
Pickles, J. (2004) A History of Spaces: Cartographic reason, mapping and the geo-coded world, East Sussex: Psychology Press.
Pratt, M. L. (2007) Imperial Eyes: Traveling Writing and Transculturation, London: Routledge. Raper, J. and D. Livingstone (1995) ‘Development of a geomorphological spatial model using object-
oriented design’ International Journal of Geographical Information System, 9, 59-383. Robinson, A. H. (1952) The Look of Maps: An Examination of Cartographic Design, Madison:
University of Wisconsin Press.
Strebe (2011) ‘Mercator projection’ (WWW), San Francisco: Wikipedia (https://commons.wikimedia.org/wiki/File:Mercator_projection_Square.JPG; 20 June 2020).
Snow, J. (1854) On the Mode of Communication of Cholera, London: John Churchill.
US National Research council (1997) Rediscovering Geography: New Relevance for Science and
Society, Washington, D.C.: The National Academies Press.
Wolter, J. A. (1975) ‘Cartography – an emerging discipline’, The Canadian Cartographer, 12, 2, 210-
216.
Wood, D. (1992) The Power of Maps, New York: Guilford Press.
World Mapper (2015) ‘Cartogram showing the proportion of the total CO2 emissions in 2015 in these territories’ (WWW), London: Worldmapper (https://worldmapper.org/maps/carbon-emissions- 2015/?sf_action=get_data&sf_data=results&_sft_product_cat=pollution; 24 June 2020).
World Mapper (2017) ‘Cartogram showing the proportion of all droughts between 2000 and 2017’ (WWW), London: Worldmapper (https://worldmapper.org/maps/droughts-2000-2017/; 24 June 2020).
